How we built our Data Platform at Quizizz
Every day, millions of teachers and learners on Quizizz generate a goldmine of data. But how do we turn all that data into meaningful, actionable insights that continually improve our platform for them? Enter our new Data Platform Team, tasked with bringing data to life and driving impactful learning across classrooms worldwide. Here’s a peek behind the curtain at the foundation we’re building for anyone on a similar journey either as a lone analyst in a young startup or an analytics leader at a company looking to overhaul its data stack.
As you read through, if you have any feedback for us, we’d love to hear from you in the comments below!
Data Sources
Let’s start off with our data sources at Quizizz. Primarily, there are two categories of data sources that we consume:
Internal Data: This contains all the data generated by Quizizz, primarily derived from usage of the product
External Data: This is the data we source from all the 3rd party tools we use
Internal Data
Our platform’s data backbone is MongoDB, with additional layers from:
Cassandra: Stores in-product reporting data
Redis: Temporary store for caching as well as other use cases
ElasticSearch: Serves search results and recommendations
Clickhouse: Serve real-time analytics to our end users
Pinecone: Recent addition to power AI features
Most of our internal data is ETL'd from MongoDB. The system reads chunks of Mongo Operations log (oplog) once every 30 minutes and writes to BigQuery. The data is not modeled in any way, and lands in bigQuery as a JSON object in a single column.
External Data
Beyond our own platform, we leverage a powerhouse lineup of external tools that keep our data ecosystem dynamic and robust. We use:
Zendesk, just to name a few
To bring all this data together, we rely on Fivetran for data integration. It’s our go-to for ETL, for pulling data into our warehouse from these various sources, though we have had some twists along the way like migrating from Stitch to address model completeness (for instance, we always struggled to get full Stripe subscription data).
One heads-up: Fivetran’s billing based on Monthly Active Rows (MARs) keeps us on our toes with its dynamic pricing, making it tough to nail down monthly costs. We’re learning as we go, and here’s a quick tip we picked up:
Tip: Fivetran doesn’t charge for the first 2 weeks of a new sync, so explore every table during this grace period! Once you see what’s useful, refine your selections to avoid unnecessary costs — selecting all tables could mean a surprise bill if unchecked; a possible bankruptcy, too!
For certain elements which cannot be synced directly via Fivetran, we have our own custom scripts to fill in the gaps.
Transformations
Once data lands in our warehouse, the magic really begins!
Using dbt (Data Build Tool), we streamline and structure our data so it’s not only just useful but also impactful. With dbt, our team handles transformations in BigQuery without relying on engineering for every change. This flexibility means we can adjust and optimize data models quickly, ensuring the freshest insights are just a query away.
As of late 2024, our pipeline boasts about 800 data models, organized into two core "layers":
- The Base Layer: This is where raw data gets its first polish. Think of it as our prep station for everything that enters BigQuery. It’s also where we tackle JSON files, ensuring naming consistency, data types, and streamlined formats to support smooth downstream analysis.
- The Consumption Layer: This is where each team can access insights tailored to their specific needs. With datasets aligned to pods and team use cases, this layer empowers analysts across Quizizz to find the data they need and build reports that drive real results.
Both layers refresh within the same command in the same dbt job, and their refreshes are sequential.
The cost for refreshing both layers is about $150/day, a small investment for the clarity it brings across teams.
Self-Serve Analytics
Now, we can make more sense with the data we have and start doing analytics on top of it. We use a variety of tools to make it seamless for people from different functions in the company to be able to get answers to their questions.
To make this possible, we host a self-managed instance of Metabase, chosen for its intuitive query builder that anyone can use. After trialing Superset and Redash, we landed on Metabase based on its user-friendly design and internal user feedback. Today, teams create and curate dashboards, pull insights on demand, and answer many of their data questions without waiting on analysts. With enriched fields and ready-to-use aggregates in our clean dataset, we’re seeing more autonomy and more impactful decisions driven directly by data.
Fun fact: Self-hosting Metabase via AWS Elastic Beanstalk costs us just $70/month. With the average querying cost around $25/day, it’s been a budget-friendly way to democratize data across the org.
Custom Tools
For those projects needing a bit more power, we turn to Hex, a platform that combines the versatility of a Python environment with an interactive dashboard setup. This lets us create internal tools that respond to user input, like our:
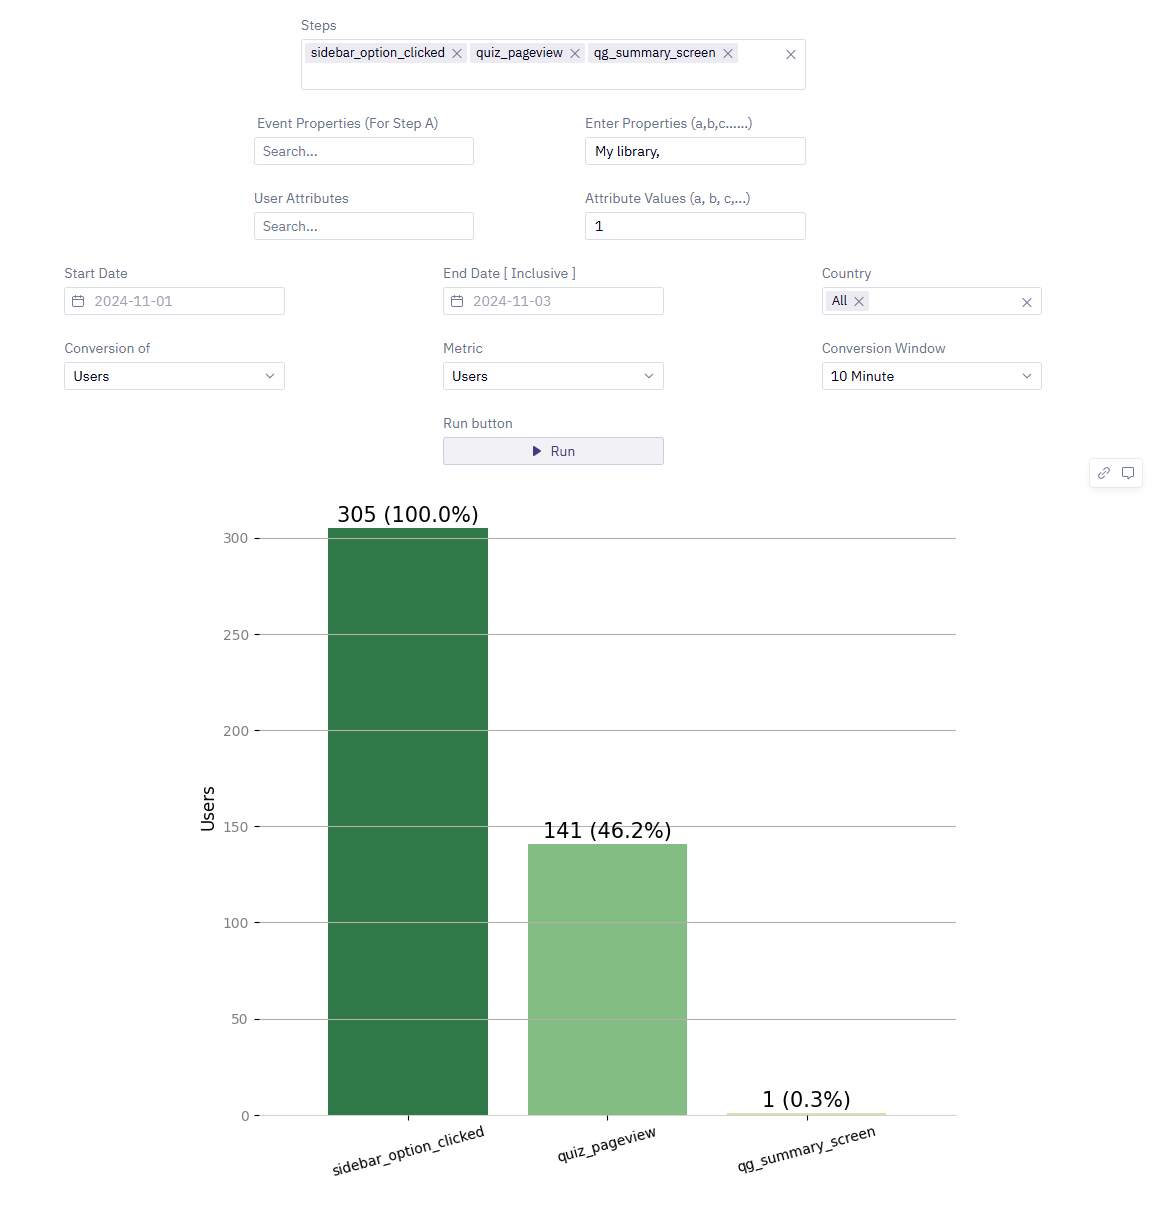
Funnel Builder
Built atop the modeled events data, this is an easy-to-use dashboard that helps Product Managers and Designers visualize product funnels. They can filter on various user/event attributes. This has greatly reduced the dependency of product stakeholders on product analysts to understand our user funnels.
Experimentation Dashboard
This dashboard lets product stakeholders easily access A/B test results. We’ve curated our L0 metrics and given the flexibility to perform A/B tests on conversion rates between any 2 events or page views. The dashboard also renders the underlying SQL queries for others to augment them for their special use cases.
Reverse ETL
With rich user data now in our warehouse, we can also now power data flowing back into the 3rd party tools we use, empowering multiple functions like GTM, sales, and success teams with powerful metrics to engage with our users more effectively. This way, our teams have up-to-date insights right where they need them, keeping communication targeted and relevant.
The logic for the enrichment is maintained in dbt, in our reverse_ETL dataset. While tools like Hightouch and Census offer reverse ETL solutions, we found their pricing models a bit priced for the value they provide. Instead, we handle this with Python and Golang scripts customized to our specific needs.
What’s next?
We’re just getting started. As we look ahead, our focus is on taking our data capabilities to the next level, adding both depth and efficiency to our processes:
More Product Analytics Tools
We’re working on releasing more interval analytics tools such as cohort builder, trend builder, and product flow builder to empower all functions to be able to do more.
Orchestration Framework
The warehouse is becoming more ubiquitous, with pipelines making a stop via it. Managing cron jobs is becoming more difficult and we want to move away from the current model.
With these projects in the pipeline, we're gearing up for an exciting close to 2024, strengthening Quizizz into a more data-powered platform for our teams, educators, and students worldwide!
We’re on the lookout for people who can help us build the next version of our Data Platform as well as our core product. If you are passionate about building great consumer products, have a knack for tinkering with newer technologies and you like to work with great minds, Quizizz is the place to be.
We’re hiring across all functions and levels within engineering and we want you to be part of this amazing journey ahead.


